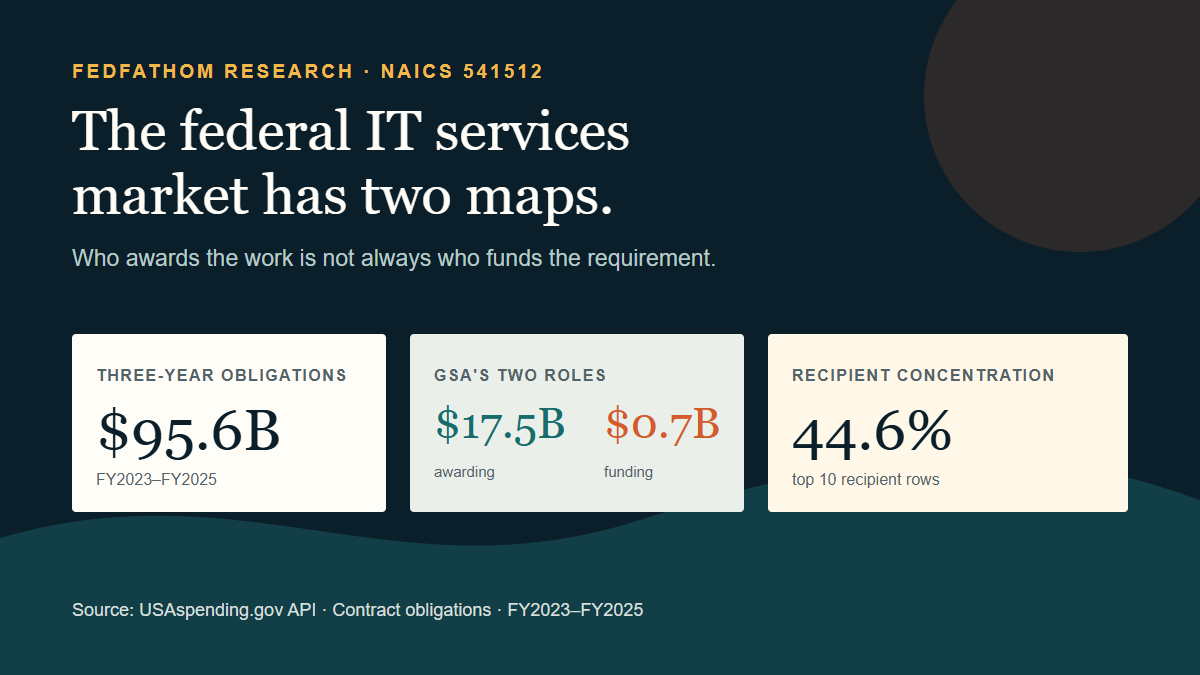
This case study asks two bounded questions. First, what do three complete fiscal years of official USAspending data show inside NAICS 541512? Second, what inspectable award evidence does FedFathom return for one capability description under the same date and NAICS filters?
The whole-market analysis began with NAICS 541512: Computer Systems Design Services . The FedFathom analysis began with what a company actually does:
Cloud modernization, cybersecurity, data integration, and DevSecOps.
The distinction matters. The aggregate API measures historical obligations inside the stated market boundary. FedFathom produces a relevance-ranked research snapshot for follow-up. Neither result is a forecast, and the FedFathom snapshot is not evidence that the product outperforms keyword search.
Two tools answered different questions; one comparison remains untested
| Research question | Method used | Result |
|---|---|---|
| How much obligation activity appears in the NAICS 541512 filter? | USAspending aggregate API | $95.554B across FY2023-FY2025 |
| Where does this capability appear in historical award evidence? | FedFathom Market Research | 610 matching contract awards in a bounded Search snapshot |
| What should a contractor investigate next? | FedFathom results plus official award links | Buyer, vendor, PSC, language, award, and period-end leads |
| Did FedFathom outperform a free keyword search? | Not tested | No keyword baseline, blinded relevance sample, or precision estimate |
The 610 FedFathom matches are not a market total or market-share denominator. They are a relevance-ranked research set produced from the capability description and filters. The $95.554 billion figure comes from a separate, filter-wide USAspending aggregation.
Observed obligations stayed above $30 billion, with an FY2025 decline
Using the USAspending API, I filtered contract activity to NAICS 541512 for FY2023 through FY2025.
| Fiscal year | Contract obligations |
|---|---|
| FY2023 | $30.519 billion |
| FY2024 | $33.358 billion |
| FY2025 | $31.676 billion |
| Three-year total | $95.554 billion |
The same filter returned 33,202 contract awards.
Obligations rose 9.3% in FY2024, then fell 5.0% in FY2025. FY2025 remained 3.8% above FY2023, but three points do not establish a trend.
This three-year window does not establish durability or forecast FY2026. The analysis did not test whether the FY2025 decline reflected acquisition timing, negative modifications, classification changes, program transitions, or a broader change in demand. That question requires additional years and award- or transaction-level investigation.
What we actually ran in FedFathom
On July 24, 2026, we ran the following production Market Research search against FedFathom's imported USAspending award corpus:
Cloud modernization, cybersecurity, data integration, and DevSecOps.
| Filter | Value |
|---|---|
| Date from | October 1, 2022 |
| Date to | September 30, 2025 |
| NAICS | 541512 |
FedFathom returned 610 matching contract awards. It then summarized the matched evidence by agency, vendor, keyword, NAICS/PSC combination, and period-of-performance end date. Similarity percentages in the product are heuristic comparisons, not probabilities of fit or future award.
This is a product demonstration, not a product-validation benchmark. No keyword baseline was run, no result sample was graded against a predefined relevance rubric, and no precision, recall, false-positive, or baseline-only finding was measured. The defensible conclusion is that the search produced inspectable leads—not that those leads were more complete or relevant than a free alternative.
The buyer signals became a focused research list
| Agency in the matched snapshot | Matching awards |
|---|---|
| Department of Defense | 292 |
| General Services Administration | 104 |
| Department of Health and Human Services | 60 |
| Department of Homeland Security | 20 |
| Department of Transportation | 19 |
These are counts inside the 610-award Search snapshot, not agency-wide totals. Their bounded use is hypothesis formation: DoD, GSA, and HHS are candidate buyer ecosystems to investigate for this capability wording, subject to award-level review.
The code map became more specific than one NAICS code
| PSC in the matched snapshot | Matching awards | Research implication |
|---|---|---|
| DA01 | 204 | Application development support |
| D399 | 75 | Other IT and telecommunications |
| DJ01 | 73 | Network operations support |
| R499 | 37 | Other professional support |
| R425 | 21 | Engineering and technical support |
The aggregate API had already shown that DA01 is the largest PSC in the whole NAICS market. FedFathom added a capability-specific view: the same search also reached network operations, professional support, and engineering work. That produces a broader candidate vocabulary than the phrase "cloud modernization" alone, but each term still requires relevance review against the underlying awards.
Representative awards made the signals auditable
| Buyer / office | Vendor | Codes | Official evidence |
|---|---|---|---|
| Treasury / IT Strategy and Modernization | CoreSphere, LLC | 541512 / D306 | View award |
| Treasury / IT Strategy and Modernization | Booz Allen Hamilton Inc. | 541512 / R425 | View award |
| Air Force / ACC 38 CONS | Cyber Systems & Services Solutions LLC | 541512 / R425 | View award |
| Air Force / AFLCMC PZI | Integrated Data Services, LLC | 541512 / DA01 | View award |
FedFathom also surfaced established vendors throughout the matched set, including Leidos, HPI Federal, Deloitte Consulting, Accenture Federal Services, General Dynamics Information Technology, Peraton, and Booz Allen Hamilton. Those names are research signals—not a market-share ranking. Each result retains an official USAspending link so the underlying award can be checked before it informs a pursuit decision.
The agency administering the award may not fund the requirement
USAspending distinguishes between the organization that creates and administers an award and the organization that pays for it. Its official awarding-agency versus funding-agency explainer makes the difference explicit.
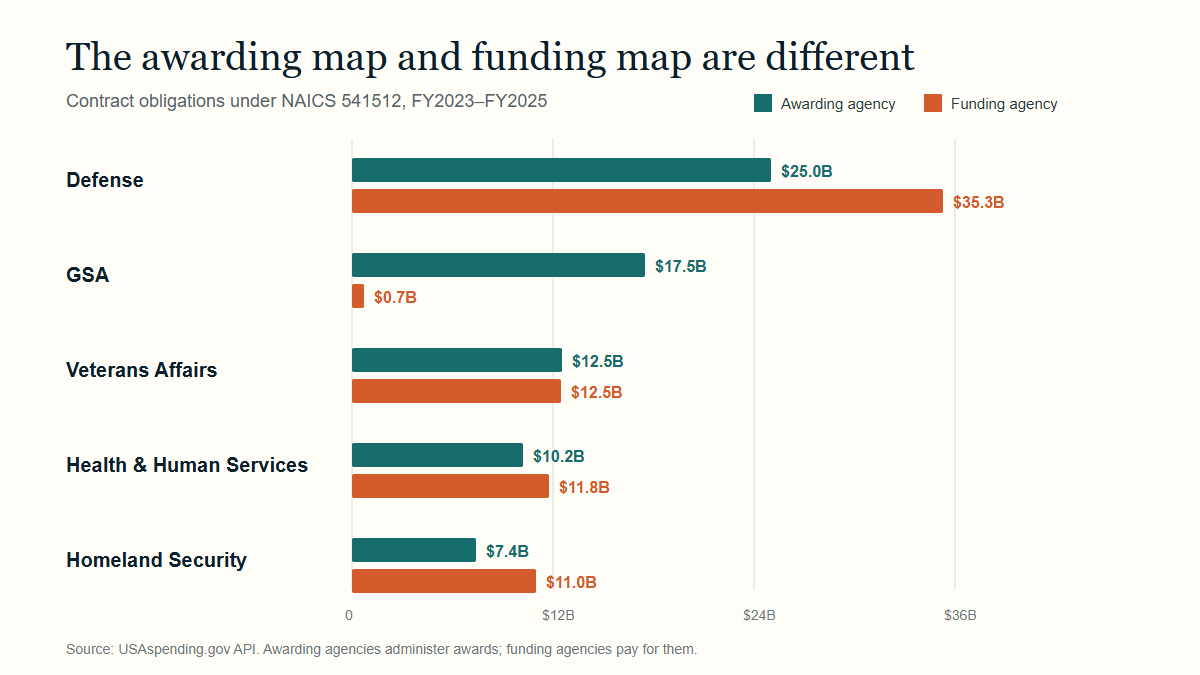
| Agency | Awarding obligations | Funding obligations |
|---|---|---|
| Department of Defense | $25.035B | $35.313B |
| General Services Administration | $17.501B | $0.726B |
| Department of Veterans Affairs | $12.537B | $12.510B |
| Department of Health and Human Services | $10.246B | $11.779B |
| Department of Homeland Security | $7.431B | $10.966B |
The largest contrast is GSA. It represents 18.3% of obligations when grouped by awarding agency, but only 0.8% when grouped by funding agency. The Federal Acquisition Service alone administered $17.244 billion in obligations under this filter.
That is strong evidence of GSA's role as an acquisition channel for demand funded by other agencies. The Federal Acquisition Regulation recognizes interagency acquisitions in which one agency uses another agency's contract or acquisition assistance.
For market research, the practical consequence is simple: the contracting office and mission customer may be different account targets. Researching only the awarding agency can misidentify who owns the requirement.
The awarding-side top five account for 76.1% of filtered obligations
The five awarding agencies displayed above account for 76.1% of obligations when grouped by awarding agency. The comparison table shows those same five organizations in the funding role; it does not establish or display a top-five funding-agency share.
The largest funding-subagency rows make the underlying mission demand more concrete:
| Funding subagency | Parent | Obligations |
|---|---|---|
| Department of Veterans Affairs | VA | $12.509B |
| Department of the Air Force | DoD | $9.826B |
| Department of the Army | DoD | $8.388B |
| Department of the Navy | DoD | $7.563B |
| Centers for Medicare and Medicaid Services | HHS | $5.085B |
| Department of State | State | $3.791B |
| Internal Revenue Service | Treasury | $3.604B |
| Cybersecurity and Infrastructure Security Agency | DHS | $3.050B |
Those are not interchangeable IT customers. Defense networks, veterans' health systems, Medicare operations, tax administration, diplomacy, and civilian cybersecurity imply different missions, security requirements, acquisition histories, and incumbent ecosystems.
The five largest recipient rows account for 29.0%; company concentration is unknown
The five largest recipient rows account for 29.0% of filtered obligations:
| Recipient row | Three-year obligations | Share |
|---|---|---|
| Accenture Federal Services LLC | $7.110B | 7.4% |
| Booz Allen Hamilton Inc. | $6.040B | 6.3% |
| General Dynamics Information Technology, Inc. | $5.447B | 5.7% |
| Science Applications International Corporation | $4.737B | 5.0% |
| Leidos, Inc. | $4.330B | 4.5% |
These are recipient rows, not parent companies. The analysis did not consolidate multiple UEIs, subsidiaries, acquisitions, or joint ventures under economic parents. The 29.0% figure is therefore a row-level distribution measure, not a formal estimate of independent-company concentration.
A documented parent-level rollup could raise or lower the measured concentration and is required before making a company-level claim. For a smaller contractor, the safer use of this table is to identify established recipient rows for further vehicle, teaming, and incumbent research.
One NAICS code contains many purchasing vocabularies
NAICS 541512 sounds like one service category. Its Product and Service Code distribution shows a much wider operating market:
| PSC | What it describes | Obligations | Share |
|---|---|---|---|
| DA01 | Application development support services | $29.317B | 30.7% |
| R499 | Other professional support | $7.693B | 8.1% |
| D399 | Other IT and telecommunications | $6.584B | 6.9% |
| R425 | Engineering and technical support | $5.239B | 5.5% |
| DF01 | IT management support services | $5.059B | 5.3% |
DA01 alone accounts for 30.7% of obligations, but the five largest PSC rows together account for only 56.4%. The remaining market crosses network support, cybersecurity, service delivery, data centers, help desks, systems development, software, program management, and other categories.
A contractor searching only "computer systems design" would miss much of the language agencies use to buy work inside the NAICS boundary.
What an IT contractor should do with this information
1. Separate the mission customer from the acquisition channel
Record both the funding organization and the awarding organization. If GSA or another servicing agency administers the award, identify the office that owns and funds the requirement.
2. Choose a mission-and-capability intersection
"Federal IT" is too broad. A more useful target might be VA health-system application modernization, Air Force network operations, CMS program systems, IRS data platforms, or CISA security operations.
3. Map vehicles and established recipients
Determine how the customer has bought similar work and who already performs it. Large recipient rows make teaming, subcontracting, and vehicle access relevant research questions, but parent-company concentration requires a separate normalized analysis.
4. Build a multi-code vocabulary
Connect capability language to NAICS, PSCs, agency terminology, award descriptions, and current notices. Codes are useful boundaries, but the evidence is in the underlying awards and requirements.
5. Verify current opportunities in official systems
Use SAM.gov for current contract opportunities. Historical analysis should narrow and improve that monitoring, not replace it.
What FedFathom demonstrated—and what remains to be validated
The USAspending aggregate analysis measured observed scale and distributions inside the stated filter, including the awarding-versus-funding distinction. It did not begin with a contractor's capability or identify which individual awards were linguistically relevant.
FedFathom supplied that second layer. It translated a short capability description into a 610-award evidence set, highlighted buyer and vendor signals, identified adjacent PSC vocabulary, grouped related award modifications, and preserved links to official records.
This demonstrates output and auditability, not comparative search quality. A credible validation study must run a keyword baseline against the same corpus and filters, define a relevance rubric before review, grade a blinded sample, and report precision at a stated cutoff, overlap, uniquely useful findings, review burden, false positives, and baseline wins.
The practical workflow is therefore:
- Use aggregate data to measure observed scale and structure inside a defined boundary.
- Describe the actual capability in FedFathom and constrain the search where appropriate.
- Use matched agencies, vendors, PSCs, and representative awards to form a research shortlist.
- Open the linked official records and verify the facts that matter to the intended pursuit.
- Use SAM.gov and agency procurement channels to investigate current opportunities.
FedFathom is a research aid, not an official government source or a guarantee of future awards. Verify material information through linked official records.
Methodology and limitations
This analysis was performed on July 24, 2026 using official USAspending API endpoints. Filters covered October 1, 2022 through September 30, 2025; contract award type codes A, B, C, and D; and required NAICS code 541512. Dollar figures are transaction obligations. The award count is returned at the award level, so it is not the same grain as transaction-level dollar totals.
A separate FedFathom production Market Research search was performed on July 24, 2026 using the capability text "cloud modernization, cybersecurity, data integration, and DevSecOps," the same date window, and NAICS 541512. It returned a bounded Search snapshot of 610 matching contract awards from FedFathom's imported USAspending corpus. Snapshot counts summarize matched evidence only; they are not full-market totals, market shares, forecasts, or claims that every result is equally relevant.
Obligations can include positive and negative modifications. They are not contract ceilings, recognized revenue, profit, or a forecast. USAspending data may be revised. NAICS assignment may not describe every task under an award. Awarding and funding agency measures answer different questions and must not be summed.
Agency, recipient-row, and PSC shares use the $95.554 billion transaction-obligation total as their denominator. The 33,202 count is award-level and must not be divided into that dollar total. The agency comparison table is anchored to the five largest awarding agencies, not the five largest funding agencies. Recipient rows were not normalized to parent companies.
The FedFathom demonstration used no keyword baseline, predefined relevance rubric, blinded sample, or precision/recall estimate. It therefore demonstrates a bounded, source-linked research workflow but does not establish comparative search quality. Historical awards do not prove that a future solicitation or recompete will occur.